Archive
The Spring is Nice, but then Comes the Fall
The much awaited European Commission Forecasts for 2013-14 are out. What do they say, in a sentence? That the situation is grim, but that the EU is gradually overcoming the headwinds. So that, surprise, surprise, the second half of the year will be better.
I guess we already heard that. Every Spring forecast depicts a negative situation, and predicts an improvement in the Fall. And every year the Fall turn out as mother nature meant it to be, worse than the Spring.
I made a back-of-the-envelope exercise. The following figure depicts the forecasts error for each year of the Commission’s Eurozone GDP growth estimates from 3 different time horizons. The same year Fall forecast, the same year Spring forecast, and the previous year Fall forecast. To make it clearer, the three bars for say 2012, represent the forecast error of the Fall 2011 forecast (blue), of the Spring 2012 forecast (red), and of the Fall 2012 forecast (yellow).

I am not expert enough to judge whether these errors are “large” or “small”. Forecasting is a very difficult exercise, most notably in times of acute crises (the Commission underestimated both the severity of the recession in 2009, and the rebound of 2010). Yet, even a casual observer like me cannot help but notice two things:
- The Commission tends to be overly optimistic, and forecasts turn out to be in general higher than actual values. It should not be like this. While I expect a government to inflate a bit the figures, a non-partisan, technocratic body should on average be correct.
- Related, it is also surprising that in November of the same year the Commission is still consistently overoptimistic (yellow bar). Let me restate it. This means that in November 2012 the Commission made a mistake on GDP growth for 2012 (and in 2008-09-10-11…). November!
Taken together these two things seem to point to a political use of the Commission’s forecasts. Being overoptimistic, the people in Brussels first try to deflect criticisms of the austerity measures they help impose to most European countries; and second, probably, they hope to trigger the confidence fairy that is supposed to compensate fiscal consolidation and lift the EMU economy from the hole in which it put itself. “Look, things will be better, let’s go out and spend!”. Vain attempt, if you ask me…
If we take the average error of the past 5 years, and assume that the Commission current forecasts are equally wrong (ok, this is just a game, it really is not rigorous!), we have this:

Then I have my own forecast for growth in the EMU for 2013. It ranges from -0.54% to -1.14%. The Commission forecasts -0.3%. We’ll see…
Stones Keep Raining
Update January 2017: I redid the figure with more recent data
Paul Krugman hits hard on one of the most cherished american myths, the golden years of Reaganomics. He shows that using the middle class as a benchmark (the median family income of the economy), the Reagan decade saw a disappointing performance; this, not only if compared to the longest expansion in post war history, during the Clinton presidency, but also with respect to the much less glorious 1970s.
But, maybe, Krugman is telling a story of inequality, and not of sluggish growth. The fact that median income did not grow much during the Reagan years may not mean that growth was not satisfactory, but simply that somebody else grasped the fruits.
For curiosity, I completed his figure with average yearly growth rates for two other series: Income of the top 5% of the population, and the growth rate of the economy.
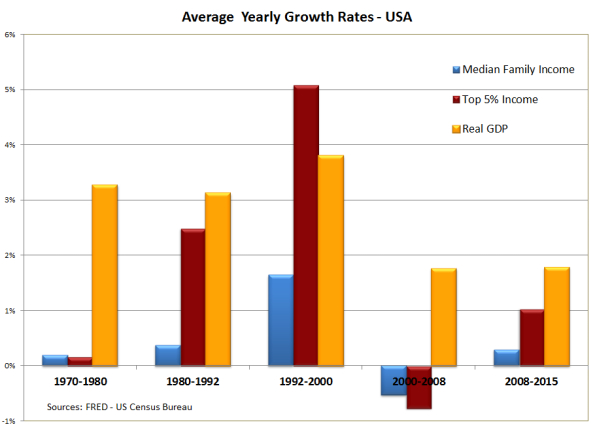
Well, it turns out that Reaganomics yielded increasing inequality and unsatisfactory growth. And well beyond that, median income consistently under-performed economic growth in the past forty years.
What seems extremely robust is the performance of the top 5% of the population. Their income increased significantly more than output over the past decades. It is striking in particular, how the very wealthy managed to cruise through the current crisis, when income of the middle class was slashed.
Nothing new, Ken Loach in 1993 said it beautifully: it is always raining stones on the working class. But I guess it does no harm to remind it from time to time…
Surprise! Spillovers Exist!
Eurostat GDP data are out. The eurozone is in recession, and it is worse than expected (-0.6% in 2012). Austerity is not working, and is recessionary. Wow, who would have said it…
Seriously, so long for the widespread optimism of a few weeks ago. The crisis is not over, we actually are in the middle of it. The way I see it, things will get worse before they get better (if they do get better).
Also interesting, Germany’s export-led growth strategy is panting. The fourth quarter of 2012 was rather bad (worse than in France, for example), and this is due to lower investment on one side, and to weaker trade (exports fell more than imports). Here is an excerpt of today’s press release of the German statistical office, Destatis:
In a quarter-on-quarter comparison (adjusted for price, seasonal and calendar variations), signals from the domestic territory were rather mixed according to provisional calculations: household and government final consumption expenditure went up slightly. In contrast, gross fixed capital formation in construction decreased a bit and gross fixed capital formation in machinery and equipment was down markedly on the third quarter of 2012. The decline of the gross domestic product at the end of 2012 was mainly due to the comparably weak German foreign trade: in the final quarter of 2012, exports of goods went down much more than imports of goods.
Germany stubbornly refuses to accommodate austerity in the periphery with a domestic impulsion. This makes adjustment for the rest more painful, and impacts expectations at home. This is why investment dropped significantly. My take on this is that if Germany had been only moderately more expansionist at home, expectations would not have been dashed (even if slightly increasing, in January the IFO index of German business confidence stagnates at around 104 at the moment, after hitting an all time high of 115.40 in February of 2011). And investment figures would be substantially better.
So, we learned today that austerity does indeed reduce growth, and that it spills to other countries. Two surprises in one day. It will need a hell of an effort to forget all of this before tomorrow!
Bringing Krugman to Europe
Well, not him, actually (I wish I could); I need to content myself with his latest post on austerity. Krugman argues that austerity is happening (it is trivial, but he needs repeating over and over again), showing that in the US expenditure as a share of potential GDP is back to its pre-crisis level (while unemployment remains too high, and growth stagnates).
I replicated his figure including some European countries, and with slightly different data. I took OECD series on cyclically adjusted public expenditure, net of interest payment. This is commonly taken as a rough measure of discretionary government expenditure. I also re-based it to 2008, as most stimulus plans were voted and implemented in 2009. Here is what it gives: Read more
Increasing Inequality: Predation or Skill Bias?
Thanks to Mark Thoma I have read a very interesting piece by David Altig on technological change and inequality. Altig weighs in the debate that Bob Gordon started a few months on the possible slowdown of trend productivity in the next decades. Bob’s argument is known, and makes sense: no current innovation, not even the fanciest ones, seems to have the potential to change our life as did railroads, jet planes, or, even more importantly, running water! But it is undeniable that he ventured in uncharted lands (innovation, future inventions, the future), and I am in the end incapable to take sides on the issue. I am just very satisfied that Bob’s argument is taken seriously, even by those opposing it.
I found interesting Altig’s remark that “game-changing technologies have, in history, been initially associated with falling capital prices, rising inequality, and falling productivity“. He ends asking whether these trends, that we are nowadays observing, could be the indicator of yet another major “game changer”. But this is also not what I want to point out. Read More
 Keynes Blog
- Più SURE, meno MES
- Come Mario Draghi ha salvato l’euro
- Le conseguenze economiche della pandemia: Mario Draghi e le scelte di politica economica ai tempi del coronavirus
- A lezione da Keynes, ripensando la macroeconomia. Recensione de “La scienza inutile” di F. Saraceno
- L’euro è una cosa troppo seria per lasciarla in mano ai soliti europeisti (e ai noeuro)
- Squilibri nell’eurozona: non è un problema di competitività di prezzo
- Intervista a Francesco Saraceno: “Sta cambiando la narrativa dell’economia ma non nella politica europea”
- Un nuovo errore di Blanchard sulla Grecia?
- La “germanizzazione” dell’Eurozona
- La politica monetaria della BCE: una sola misura non va bene per nessuno
